Monitoring
Threads
 |
This menu level is only available to server administrators. |
The page contains informationon the monitoring of the system's current state.
Thread dump:clicking on this button generates and displays a current thread dump. Clicking on ![]() xpands the displayed level. The buttons at the top of the window can be used to analyze the current thread dump and display it in a prepared view.
xpands the displayed level. The buttons at the top of the window can be used to analyze the current thread dump and display it in a prepared view.
Trace: clicking on this button groups the current threads by similar stack traces. Stack traces are grouped if they are identical except for the object addresses. The number on the right shows the number of similar traces found. The prepared view makes it possible to determine relatively easily which actions are currently in progress on the server.
Topline: clicking on this button groups the current threads by similarities within the first five lines. Similar threads are groups in the prepared view for an entry. The number on the right shows the number of similar threads found. The prepared view makes it possible to determine relatively easily at what stage of execution the threads are currently in. This view makes it easier to trace bottlenecks, such as when multiple threads are always wait at a particular location in the code.
Lock: clicking on this button analyzes the current threads by locks. If multiple threads are in the BLOCKED status (see “Status” below), they will wait for a different thread to release an object. If there are multiple objects constantly in a waiting status that are being processed at a similarly slow rate, this can be an indicator of a bottleneck.
Text: clicking on this button displays the entire unprocessed thread dump with all its information.
In addition to generating a thread dump, other dumps can be generated at particular time intervals. The total number of thread dumps desired can be entered in the first box, and the time intervals can be entered in the second input box. Clicking on the Generate button initiates generation.
Table: the table view of the page shows the status of the current threads. The thread information shown here represents a snapshot or detail of the current status:
ID: each thread has a unique thread ID for identification.
Name: name of the thread.
Status: the threads may have different statuses:
- NEW – newly generated thread that has not yet been started.
- RUNNABLE – the thread is being processed or is waiting to run (waiting for CPU).
- BLOCKED – the thread is waiting for a lock to be released.
- WAITING – the thread is waiting for another thread before it can continue.
- TIMED_WAITING – the thread is waiting for a specified time to elapse (e.g. after sleep() or wait() is called using Timeout).
- TERMINATED – the thread has been terminated.
IN (In Native): provides information on whether the thread is executing native code via the Java Native Interface (JNI) (true) or not (false).
SP (Suspended): provides information on whether a thread has been started (false) or not (true).
BC (Blocked Count): the number provides information on how often a thread was in the BLOCKED status during execution.
WC (Waited Count): the number provides information on how often a thread was in the WAITING status during execution.
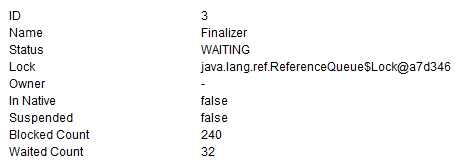
Clicking on a thread within the table opens the thread's detail window. Here all table information is clearly listed and the lock object and “owner” are also displayed.

Figure: Threads – Details
Lock: if the thread's status is BLOCKED, it is waiting for the lock object specified here to be released.
Owner: if a thread's status is BLOCKED, the name of the thread currently holding the lock on the object is output.
The other information is described within this Chapter (see above).


