

The FirstSpirit Debugger
| Contents |
The Template Debugger is called via the ![]() icon on the horizontal tool bar. Debugging (even for FirstSpirit objects which have been debugged recently) is started via the arrow.
icon on the horizontal tool bar. Debugging (even for FirstSpirit objects which have been debugged recently) is started via the arrow.
For a general overview of how the Debugger works, see page Where is the error?
Activating Debugger / Permissions
In order for this functionality to be available or usable in SiteArchitect, appropriate permissions must first be configured for the desired user group(s).
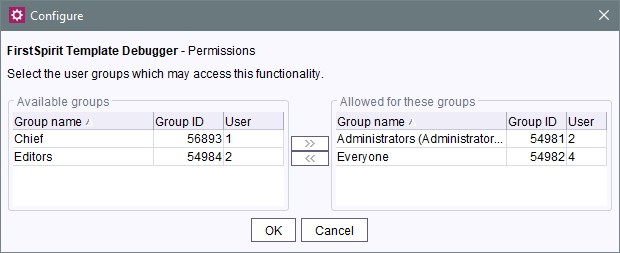
The corresponding configuration settings are made with the “FS-TemplateDebuggerProjectPermissions”. project component that is included in the scope of delivery. It must be added to the required project in the FirstSpirit ServerManager (under “Project components”). Click “Configure” or double-click the project component to open a dialog in which the required group(s) can be selected (see figure).
The groups that have access to the project are displayed on the left-hand side (“Available groups”), the groups that are permitted to use the corresponding function are displayed on the right-hand side (“Allowed for these groups”) along with their ID and the number of users they contain. To check which users belong to a group, select “Show users” from the context menu.
The icon is displayed on the horizontal tool bar in SiteArchitect for members of the “allowed groups” (right-hand side). The corresponding icon is hidden for users who are not in one of the selected groups. To move a group to the right-hand side or left-hand side, select it and
- click the icons
 ,
, - double-click or
- select the corresponding command from the context menu (“Allow group(s)” or “Remove group(s) from allowed”).
The “Template Debugger” and the Template Inspection functionality are interdependent, it is only possible to specify the same permissions.
View and functions in the AppCenter
In the AppCenter, a new window opens in which the functions supported by and information relating to the Template Debugger are displayed. This window also opens automatically when the Template Inspector is started.
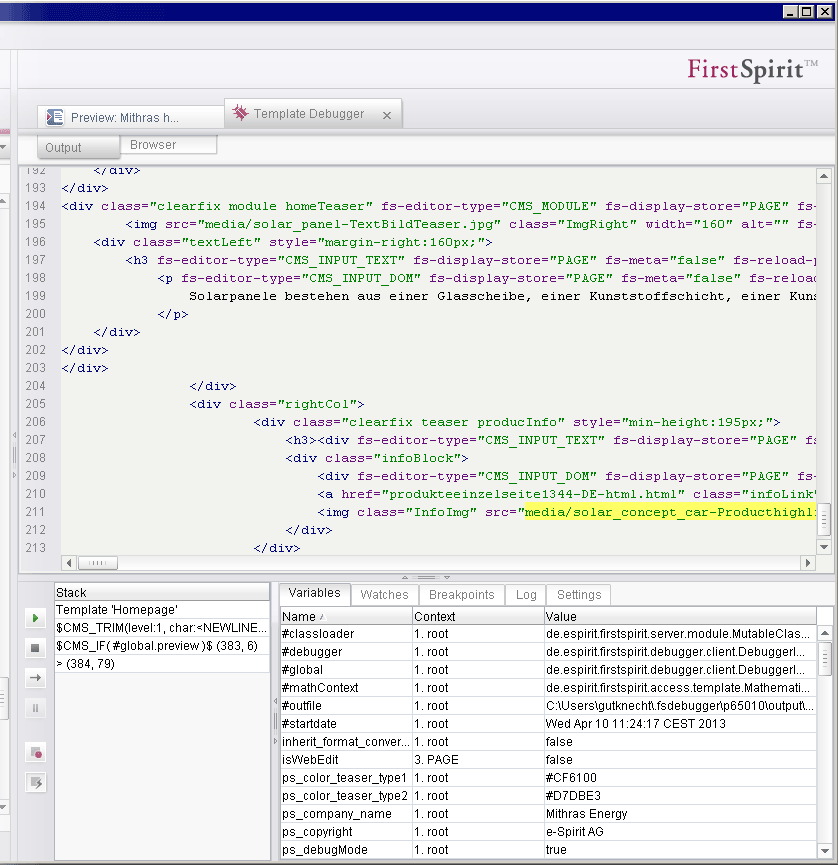
The Template Debugger features the following areas and tabs:
Output (1)
The current HTML output is displayed in this area in HTML code. Click on the output to jump to the corresponding location in the code on the output tab of the associated template.
Browser (2)
The visual representation of the current HTML output is (“rendered”) displayed in this area.
Stack (3)
The location in the template structure in the context of which the Debugger is currently located can be read off in this area. The templates (Template '...') and FirstSpirit expressions (e.g., $CMS_VALUE(...)$) leading to the current page are listed from top to bottom.
Double-click an entry to jump to the corresponding template or code location in the workspace. The area in which the expression is located is highlighted in color.
Variables (4)
All variables existing at the the current execution time are listed on this tab with their Name, Value, and Context. They can be sorted by clicking on the column header.
More detailed information about variables is also available in the Variables section.
To add a variable to the “Watches” tab, select it and choose “Add to watches” from the context menu.
Watches (5)
Variables and/or expressions and their current value can be checked specifically on this tab. This is helpful primarily on pages containing a large number of variables. The variables and expressions to be monitored can be added to the fields of the “Expression” column as follows:
- Transfer from “Variables” tab (see above) via the “Add to watches” entry in the context menu
- Transfer from the HTML tab of the template via the “Add to watches ” entry in the context menu (see below)
- A list of all currently existing variables can be displayed by pressing Ctrl+Space. Click a variable to display the data type. Double-click a variable to add it to the field in the “Expression” column.
- The name of the variable to be monitored can be entered manually in the “Expression” field.
- Entering text (initial letters of the name of a variable) and pressing Ctrl+Space reduces the scope of the list of currently existing variables.
If a value currently exists for the variable, it is displayed in the “Value” column.
Methods dependent on the corresponding data type can be executed on the variables; the value returned is displayed directly in the “Value” column. To display the methods that are available for the current variable, press Ctrl+Space. A period must be entered after the variable in the “Expression” column for this purpose.
- Send to editor
If the current template in the workspace is in editing mode, select this entry from the context menu to add the content of the “Expression” column to the HTML code at the insert point. - Remove watch
Select this entry from the context menu to delete the content of the current line.
Breakpoints (6)
Breakpoints can be set to stop the evaluation/debugging process automatically at defined locations in the code. This can be useful in the case of longer code in particular, in order to structure the code for a debugging process so that it does not always have to run step by step from beginning to end during debugging, for example.
Once breakpoints have been set, they are listed on this tab.
Breakpoints can be set on the HTML tab by clicking on the required line number or selecting the “Add to watches” entry from the context menu.
If a breakpoint has been set in a line that cannot be executed (an empty line, for example), it is moved to the next executable line and the debugging process is stopped there accordingly.
One or all breakpoints can be removed via the context menu or on the HTML tab for the corresponding template in the workspace.
Active: Check this box to activate or deactivate the corresponding breakpoint temporarily. If this box is not checked, the breakpoint is ignored. The highlighting of the line on the HTML tab for the corresponding template changes from red to yellow. See also View and functions in the workspace.
All breakpoints can also be ignored by selecting the “Mute breakpoints” option (see below).
Template: The name of the template in which the breakpoint is located is displayed in this column, along with the line number. Double-click in a line to jump to this location in the workspace.
Source: The expression at which the Debugger stops is displayed in this column.
Log (7)
Log outputs are displayed on this tab.
Settings (8)
The following settings can be made on this tab:
- #global.language
The project language for which debugging is to be executed is selected from this drop-down list. - #global.templateSet
The template set for which debugging is to be executed is selected from this drop-down list. - #global.preview
This checkbox sets the global variable #global.preview to the Boolean value true or false. With this, during debugging a behavior related to this variable can be simulated which corresponds to a preview or a regular generation process.
Note: Regardless of the setting, the values for the debugging process are pulled from the current state.
Changes in this area are not applied until the next debugging run.
All entries and settings made on the “Watches”, “Breakpoints”, and “Settings” tabs are saved locally for the project.
The following functions are also supported (9):
![]() Start / resume debugging session
Start / resume debugging session
Starts the Debugger. If breakpoints have been set (see above) or if the “Break on error” option is activated (see below), the Debugger session will stop when breakpoints or errors are encountered. Debugging can then be resumed by clicking this icon again.
![]() Stop debugging session
Stop debugging session
Stops the Debugger session.
![]() Step forward
Step forward
Step-by-step execution of the template code. A FirstSpirit instruction is evaluated every time a step is taken.
See also the relevant section for detailed information about FirstSpirit instructions.
![]() Pause debugging session
Pause debugging session
Pauses the debugging session. To continue the session, select ![]() Start/resume debugging session.
Start/resume debugging session.
![]() Mute breakpoints
Mute breakpoints
If this icon is activated (not grayed out), the set breakpoints are taken into account during the next debugging run; if it is deactivated (grayed out), debugging is executed without taking the set breakpoints into account.
A breakpoint can only be deleted on the HTML tab for the corresponding template in the workspace.
![]() Break on error
Break on error
If this icon is activated (not grayed out), the following debugging run will be stopped if an error occurs; if it is deactivated (grayed out), the debugging run will not be paused if an error occurs.
View and functions in the workspace
Workspace of a template
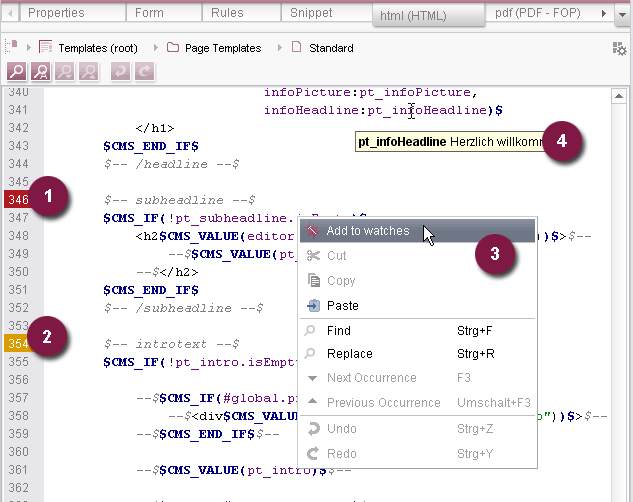
In the workspace, breakpoints can be defined on HTML tabs for templates by clicking the line number at which the debugging process is to be stopped (1).
Click the breakpoint again (2x) to deactivate the breakpoint temporarily (i.e., on the next debugging run, the corresponding breakpoint will be ignored) (2).
Click the breakpoint again (3x) to remove the it.
Expressions can be added to the “Watches” tab by selecting the “Add to watches” entry from the context menu (3).
The value of variables is displayed in a tool tip (4).