

Performance analysis on preview pages
Another helpful feature when developing templates is the analysis of performance problems as part of the preview calculation.
A statistic giving the calculation period for individual elements or called-up templates can be displayed on the preview page.
To call up this statistic, simply copy the preview page URL from the SiteArchitect URL line, paste it into a separate browser window, and add the parameter
/showLog=profile
to it manually.
Alternatively, a separate browser window can also be called up via the external preview and the parameter then added to the preview URL there.
Displaying the performance analysis on a preview page
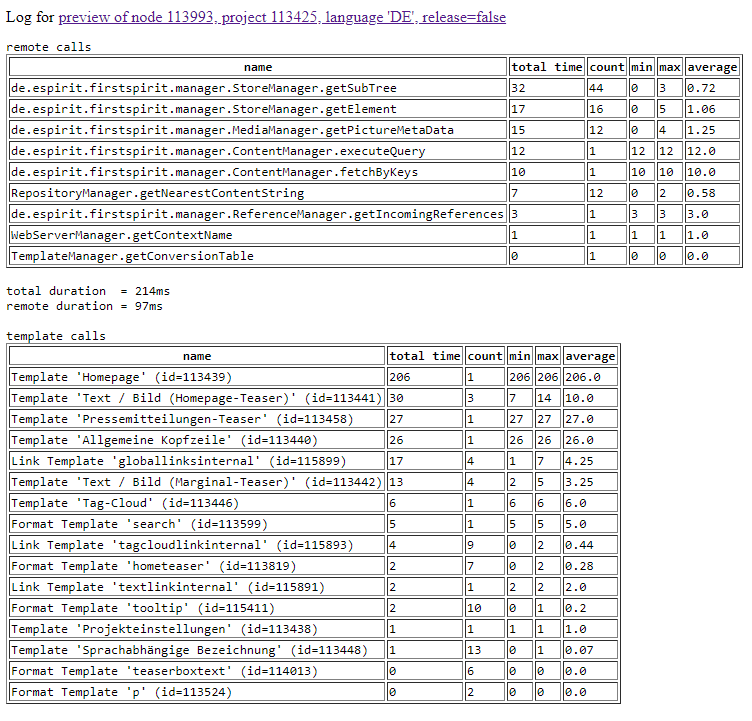
Example of a performance analysis
The times are stated in milliseconds in the table and are always shown as an overall total.
In other words, the time displayed for a page template is the total calculation time for the page , including the time for any elements it contains.
total duration: indicates the total time for the preview calculation.
remote duration: indicates the time spent waiting for external requests (e.g., database queries) during the preview calculation.