Where is the error?
Template Inspection
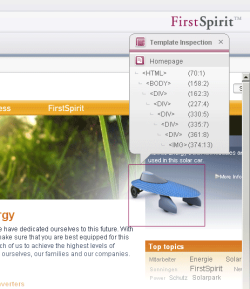
“Template Inspection” was introduced to make the retrieval of existing code faster. “Template Inspection” is to the template developer what Content Highlighting is to the editor: it provides the ability to display the tag structure of the HTML code of the current page in the integrated preview and from there to open the associated locations in the template code in the workspace.
The display jumps directly to the correct expression. This allows for faster retrieval and editing of locations of code in the HTML channel. As well as supporting intuitive navigation for the developer within the project, this also helps when analyzing technical relationships in the project.
See also Template Inspector.
Template Debugger
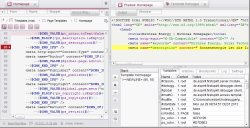
The Template Debugger both supports software-based troubleshooting in the HTML code and helps the developer when new templates are being developed or existing templates are being expanded. Using the debugger, the execution paths of the template generation can be traced in detail based on the particular HTML page currently displayed in the preview. This also applies to all dependent templates (including templates for sections, tables, formats, or links).
In this context, a single step corresponds to an expression in FirstSpirit. The HTML page is constructed further with each step, and the developer can then check the result either in the source text or in the inline browser. Clicking in the generated HTML then takes the developer straight to the corresponding code location in the relevant template. This procedure presents valuable insight into the inner workings of FirstSpirit syntax and the interaction between instructions, functions, variables, and their output in FirstSpirit, particularly for users who are new to FirstSpirit template development.
As is familiar from other debuggers, breakpoints are also defined in FirstSpirit template code. The debugger stops at these points so that the code being run through can be analyzed, thus making it possible to isolate code for troubleshooting. Errors that might have occurred can also interrupt a debugging run. The line containing the error in the template concerned is highlighted in color.
A key aspect of FirstSpirit template development is the use of variables. It is primarily variables that facilitate intelligent reuse as well as making content dynamic. In large projects in particular, where many developers are working together and many variables are in use, the number of variables can quickly become unmanageable. Which variables apply in the current area (context) and what value do they currently have? With the Template Debugger, each developer has information about variables on the currently generated page or the page displayed in the preview with the current value immediately at their fingertips, making existing variables easier to access for editing. The current value of a variable can also be checked directly on the HTML tab where the value is displayed via the tool tip for the variable. In addition, the methods related to the variables are shown, including brief documentation.
See also FirstSpirit Debugger.


